Towards Generating Human-Centered Saliency Maps without Sacrificing Accuracy
Introduction
Artificial intelligence (AI) is increasingly being built for and deployed in high-stakes domains such as detecting cancer from medical imagery
With explainability and interpretability of AI becoming increasingly important, ML researchers designed a wide range of techniques from visualizing what the model has learned from an entire dataset, known as feature visualizations
Research Questions & Contributions
Our primary research questions are:
- [RQ1] How do current state-of-the-art object detection models compare to human attention?
- [H1] We hypothesize that current state-of-the-art object detection models do not nearly compare to human attention.
- [RQ2] Can data augmentation techniques make saliency maps more similar to human attention without significantly sacrificing model accuracy?
- [H2] We hypothesize that some form of data augmentation that penalizes spurious patterns will result in more human-centered saliency maps.
We address these two research questions through two studies. First conduct a small, empirical study to understand how current state-of-the-art object detection models compare to human attention. In the second study, we evaluate the impact of novel human-centered, data augmentations on DNNs saliency maps. Our novel contributions include:
- We present two novel data augmentation techniques called Selective Erasing and Selective Inpainting along with the prevelant non-trivial transforms that can be used for augmenting images for image classification and object detection models
- We evaluate the impact that different data augmentation techniques have on saliency maps generated by Faster R-CNN.
Related Works
Several explainable artificial intelligence (AI) techniques have been proposed as new ways to provide insights into the AI’s prediction. Such techniques for computer vision tasks traditionally are presented as a heat map, highlighting the regions that most contributed to the model’s prediction. However, several empirical studies in human-computer interaction literature have evaluated the interpretability of different techniques and their impact on decision-making. We present different saliency map techniques and perform empirical studies on different saliency map techniques.
DNN Saliency Maps Compared to Human Attention
With novel interpretability techniques increasingly being developed, some researchers are taking a cognitive science approach to interpretability to understand how human attention compares to deep learning models. One study investigates if DNNs look at the same regions humans do in a visual question answering task
Towards DNNs with Human-Centered Saliency Maps
Recently, papers have proposed various routes to make saliency maps more human-centered and semantically meaningful to humans. For example, Boyd et al., propose a novel loss function that uses human annotations
Instead of continuously having to collect human annotations, the MIT/Tuebingen Saliency Benchmark has designed a challenge for saliency prediction models. This benchmark has yielded several techniques that can avoid the need for human subjects to obtain approximate ground truth human attention maps
Methods
We conducted two studies to address our research questions. Below we describe each study and how the second study uses results from the first study.
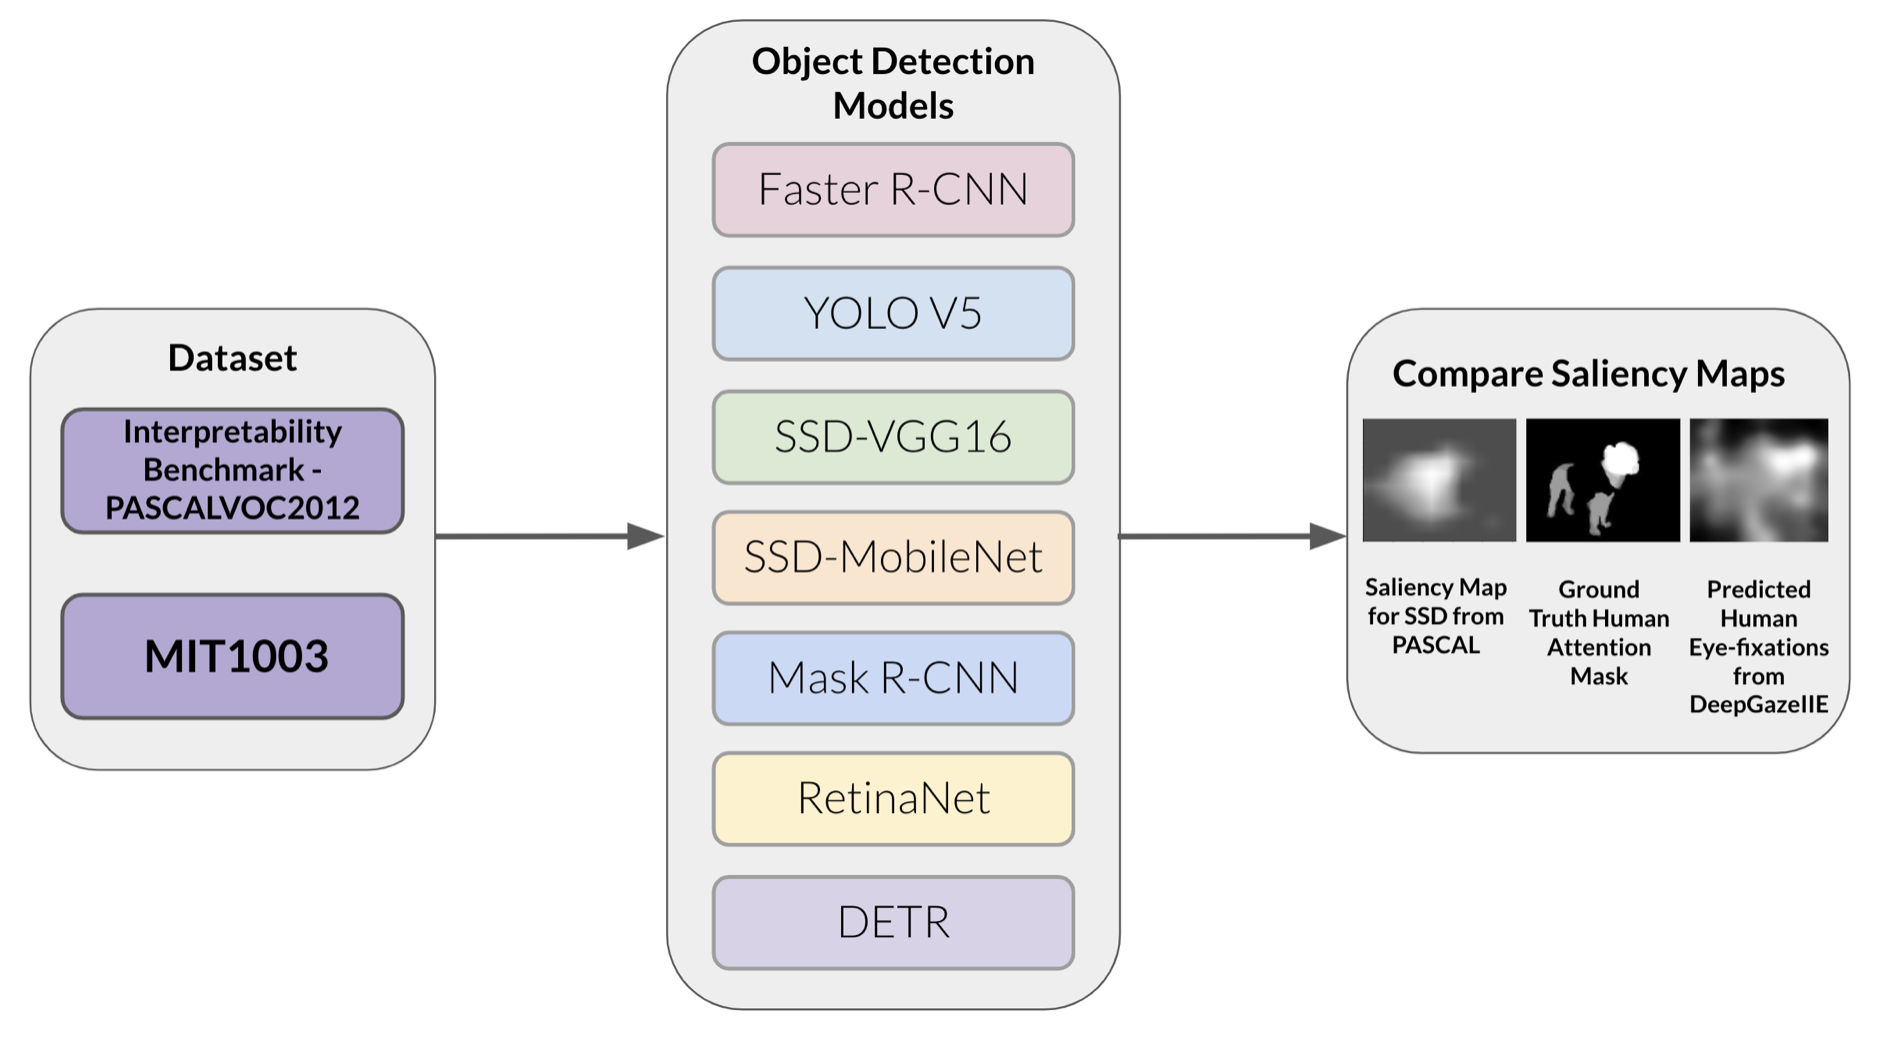
Empirical Study 
We conducted an empirical study to gain an understanding of which state-of-the-art object detection models currently generate saliency maps similar to human attention. We evaluated and compared saliency maps generated by seven different object detection models available on PyTorch to human attention maps and predicted human eye-fixations. To obtain the human attention maps, we used the human attention maps for PASCAL2012 from the ML-Interpretability-Evaluation-Benchmark
Experiment Details
We generated a saliency map for every single image that had an associated human attention map (ground truth saliency) from the ML-Interpretability-Evaluation-Benchmark
Each image was resized to \(512\) x \(512\)
before being evaluated on by the model. The saliency map for the object detection model is generated using the EigenCAM method (
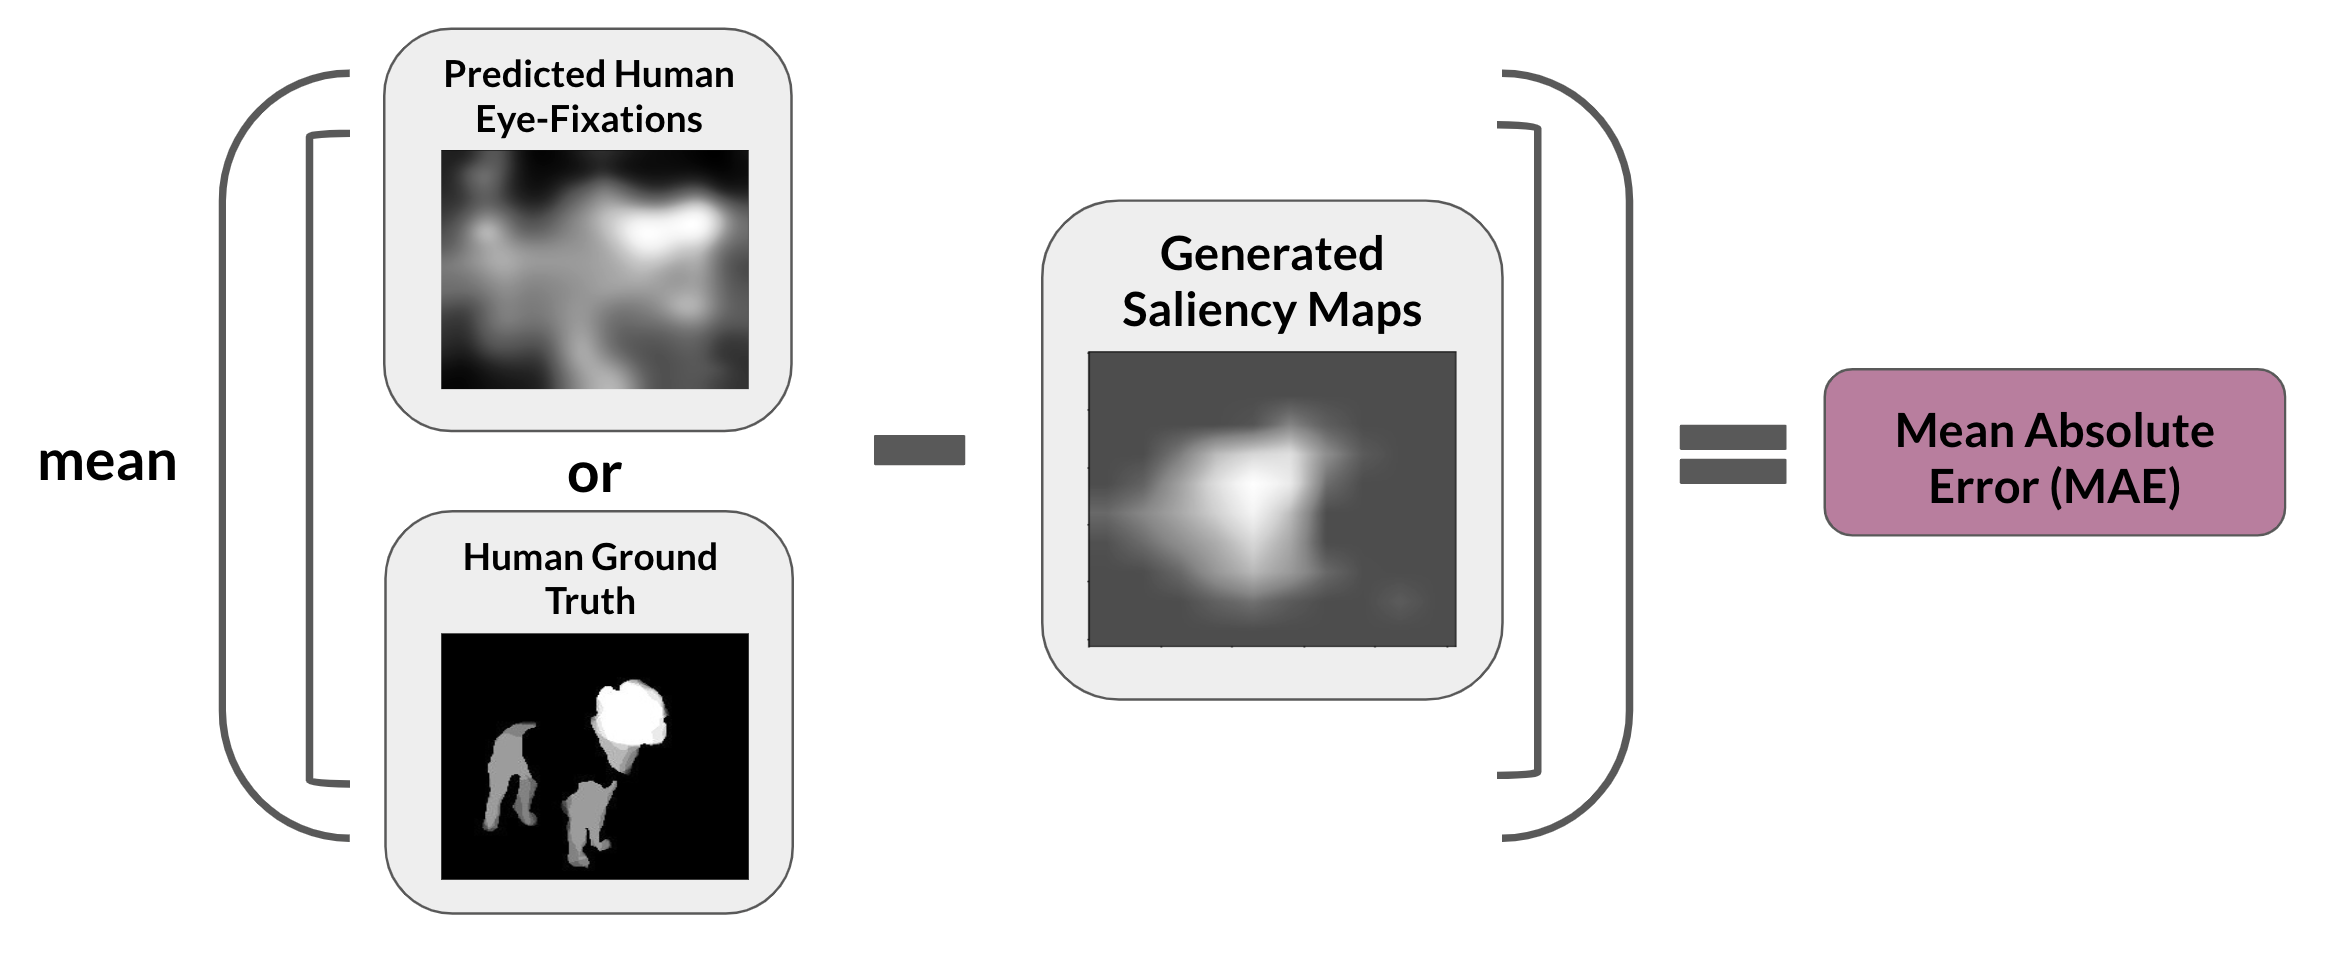
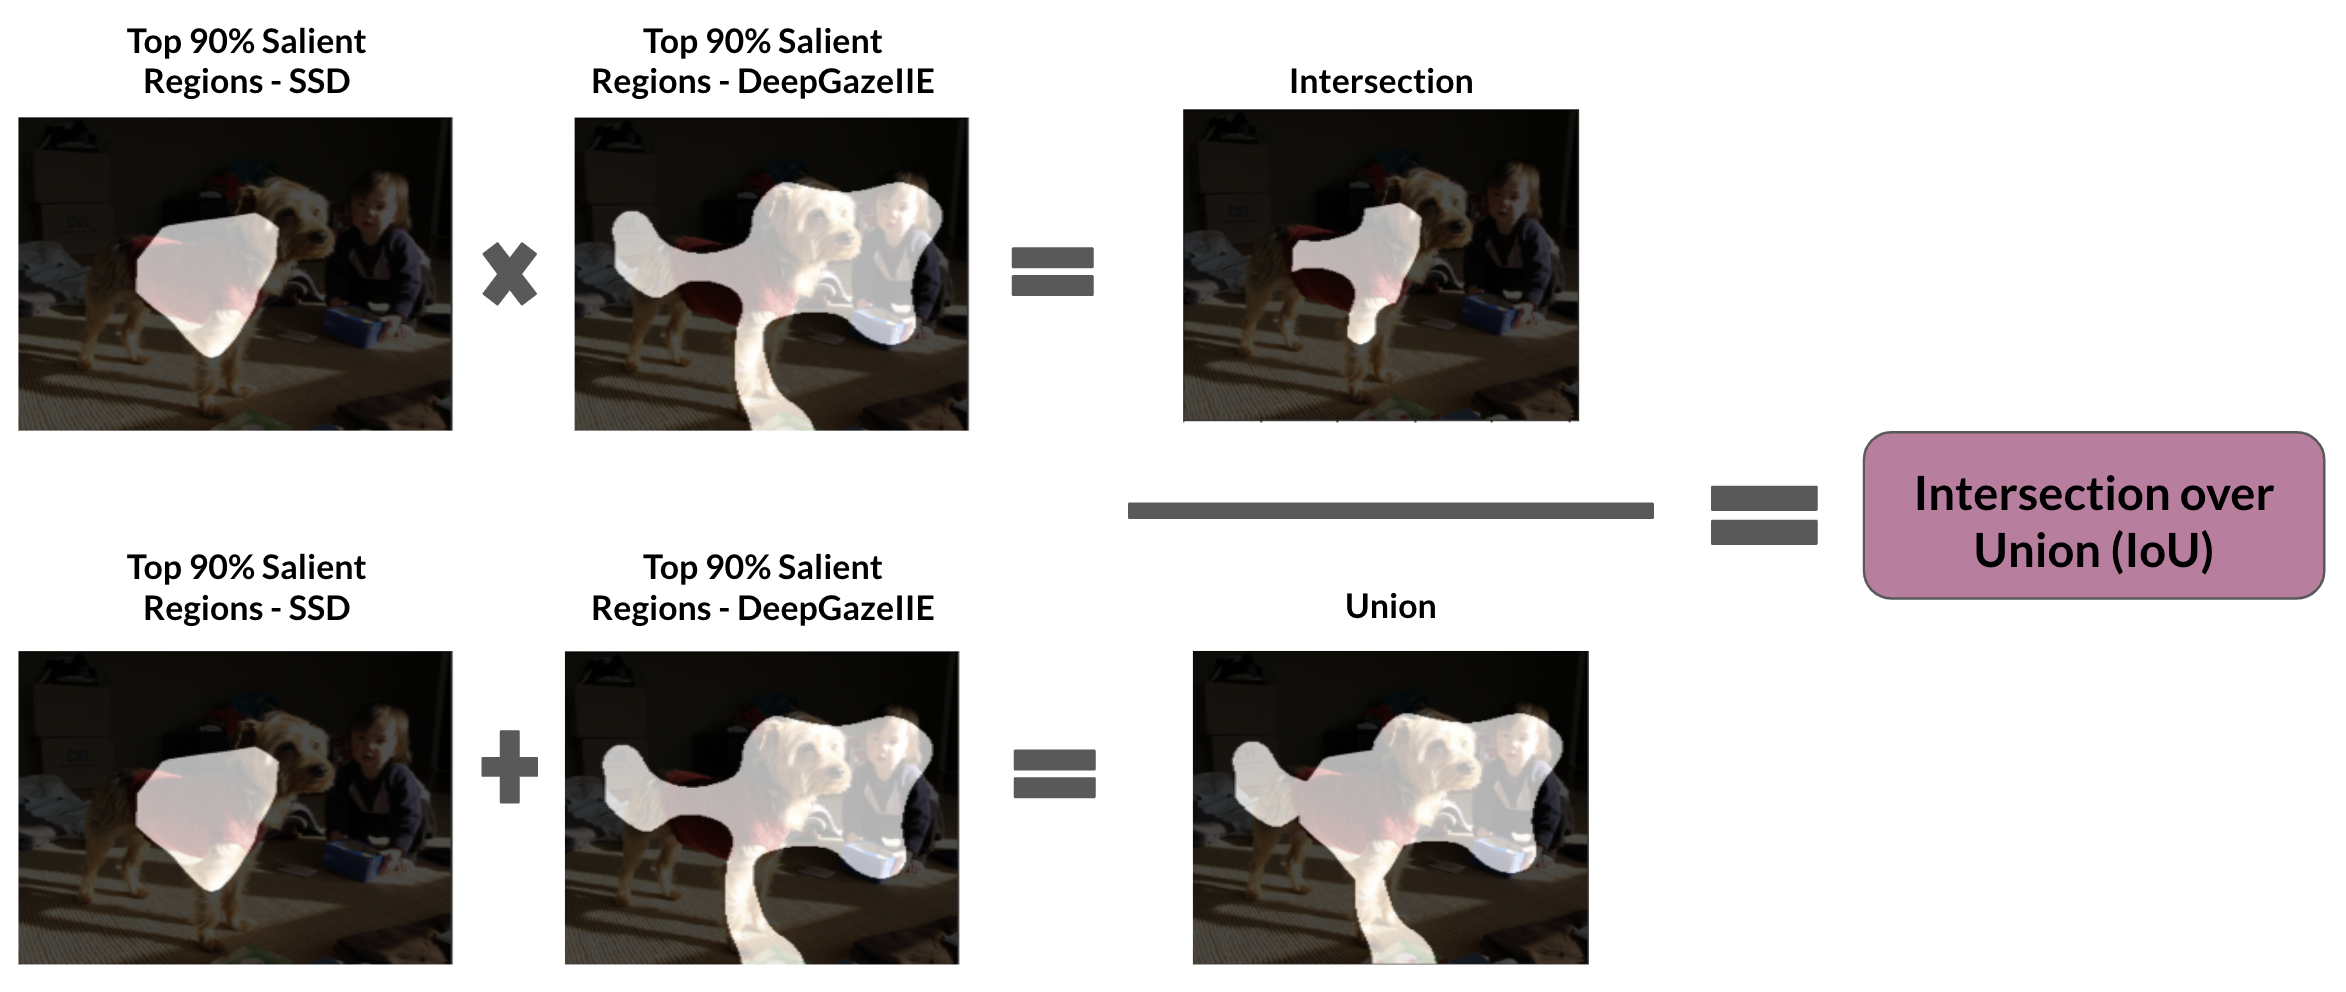
While the MAE to some extent can reveal how similar the saliency maps are, we also calculate Intersection over Union (IoU) between the top \(90\%\) salient pixels of the generated saliency map and the top \(90\%\) salient pixels from the human attention map/predicted human eye-fixation. Calculating the IoU will help reveal if the most salient region identified by the model and the humans align
Data Augmentations
Data augmentation for object detection is slightly more complex than data augmentation for image classification tasks because of the associated bounding boxes for each object
We designed three different data augmentation techniques: selective erasing, selective inpainting, and non-trivial transformations. Below, we define and provide examples of each of these data augmentations.
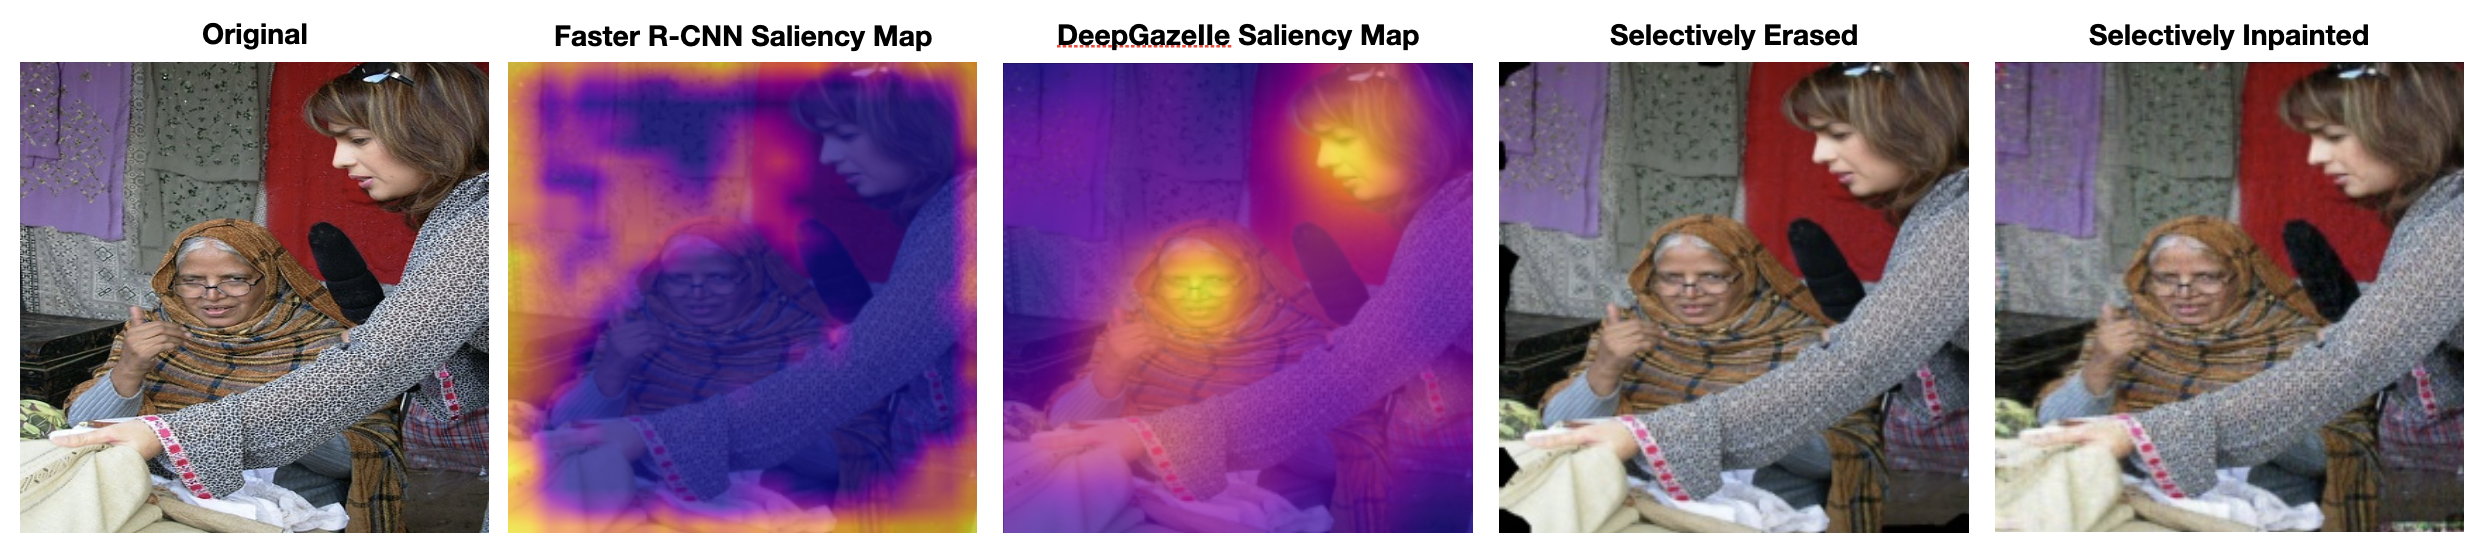
Selective Erasing ![]()
The goal of selective erasing is to get rid of potential spurious patterns, patterns that the model has learned to associate with a label even though it does not represent that label. In order to augment images using selective erasing, we send the image through Faster R-CNN and use EigenCAM to generate the saliency map from layer 4 in the backbone. We then send the image through the DeepGazeIIE model to generated the predicted eye-fixations map. We calculate the intersection over union (IoU) between the two saliency maps. If the IoU is below 0.1, meaning the two saliency maps are significantly different from one another, then we erase the top 2.5% salient pixels identified from the Faster R-CNN saliency map from the original image. We identified 6476 images that met this criteria. An example of this process and the outcomes from each step are shown in Figure 4. We chose the top 2.5% because these pixels would most likely make up the core region of a potentially spurious region.
Selective Inpainting
![]()
The selective inpainting augmentation process follows the same steps as selective erasing and then inpaints the erased image. To inpaint the top 2.5% salient pixels as denoted by Faster R-CNN, we send the selective erased image and mask into an untrained neural network and optimize on learning the pixels that minimize the chosen loss function. This idea is presented in the Deep Image Prior Paper
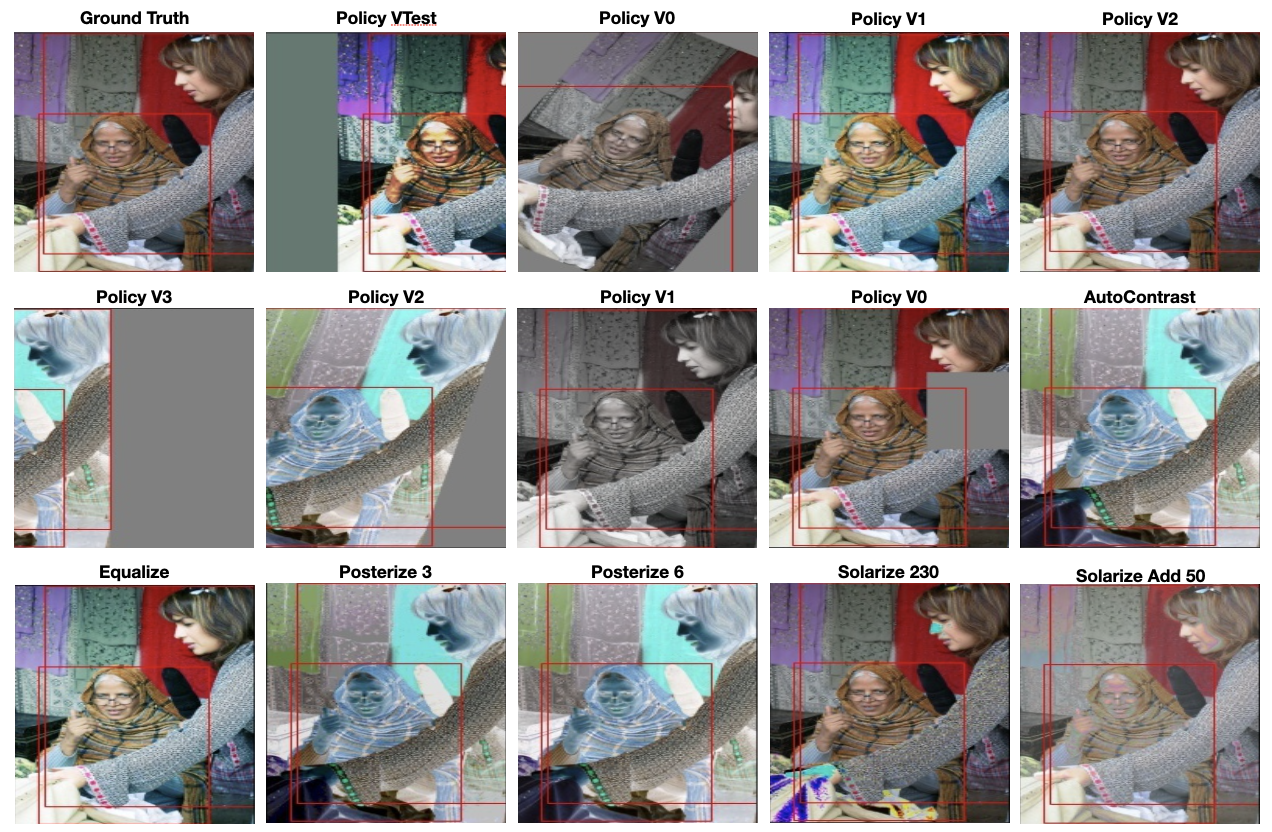
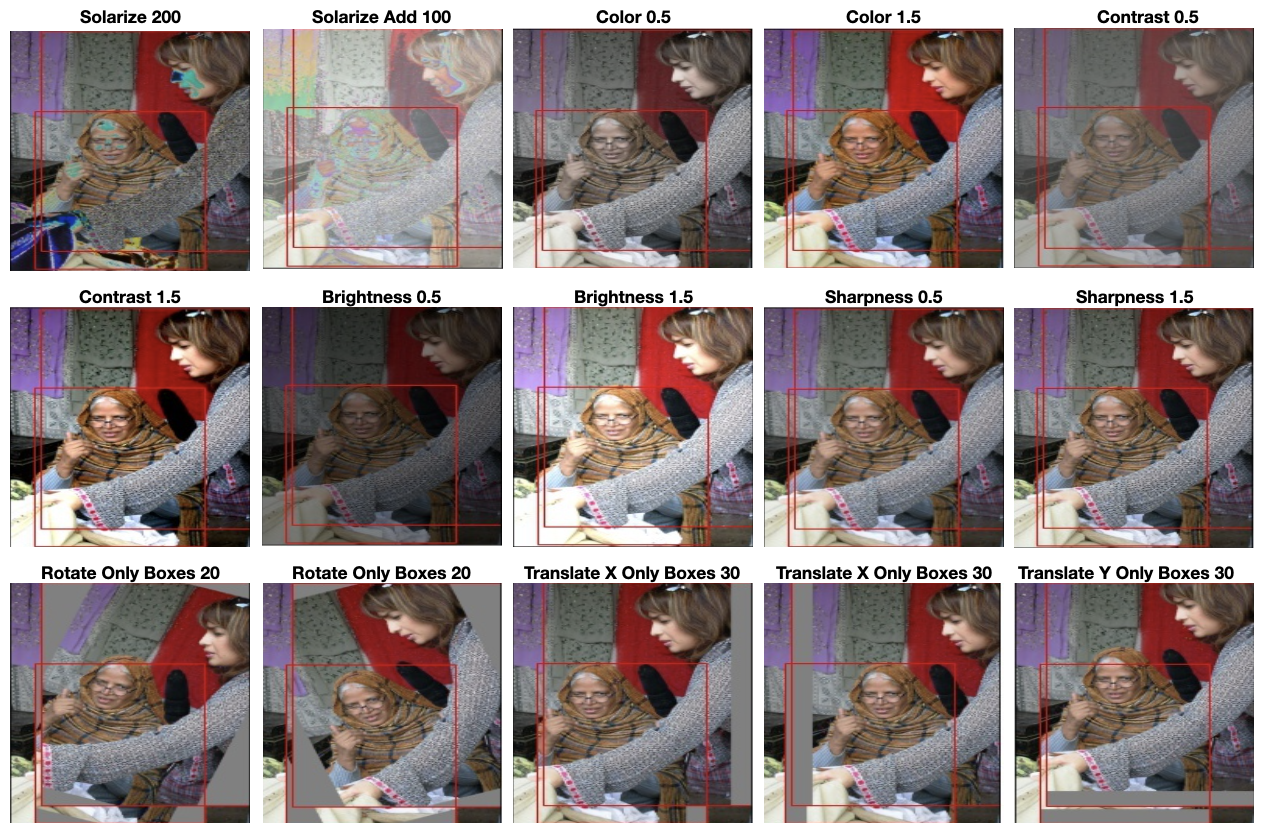
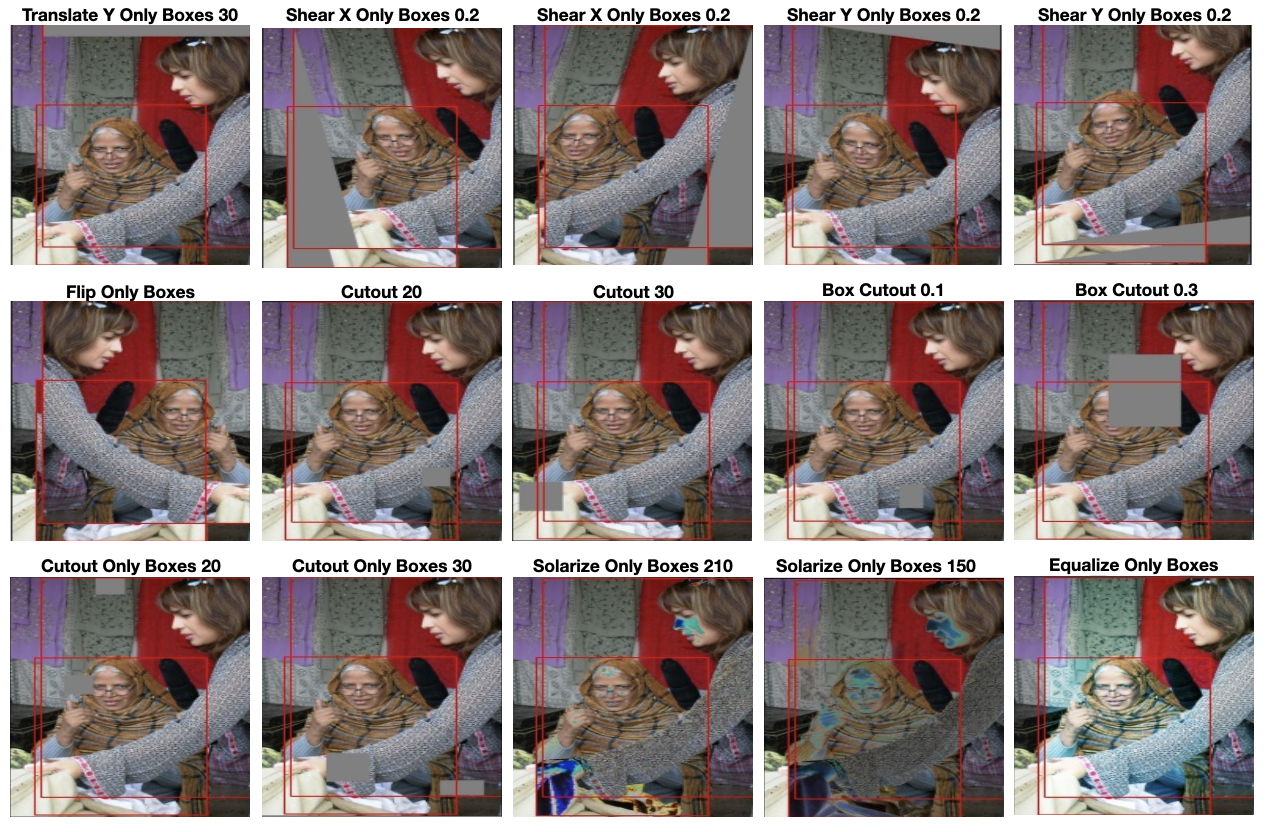
Non-trivial Transformations ![]()
Data augmentation can improve performance and outcomes of models as it can add new and different examples to the training dataset. If the dataset in a model can be more rich and sufficient with the augmentation techniques, the model can perform better. To improve the model generalization, we apply the following augmentation techniques seen in Figure 5. In our experiment, we do experiments of bounding box geometric augmentation, color augmentation, and geometric augmentation. Augmentations considered in this experiment are from the PIL.ImageOps as well as torchvision.transforms libraries. The source codes are from the following repos: imgaug and AutoAugment for Detection Implementation with Pytorch. Each image in the dataset was augmented only once with a random augmentation selected from Figure 5. This was to ensure we had the same amount of data to fine-tune on as the other augmentation techniques.
Experiment Design
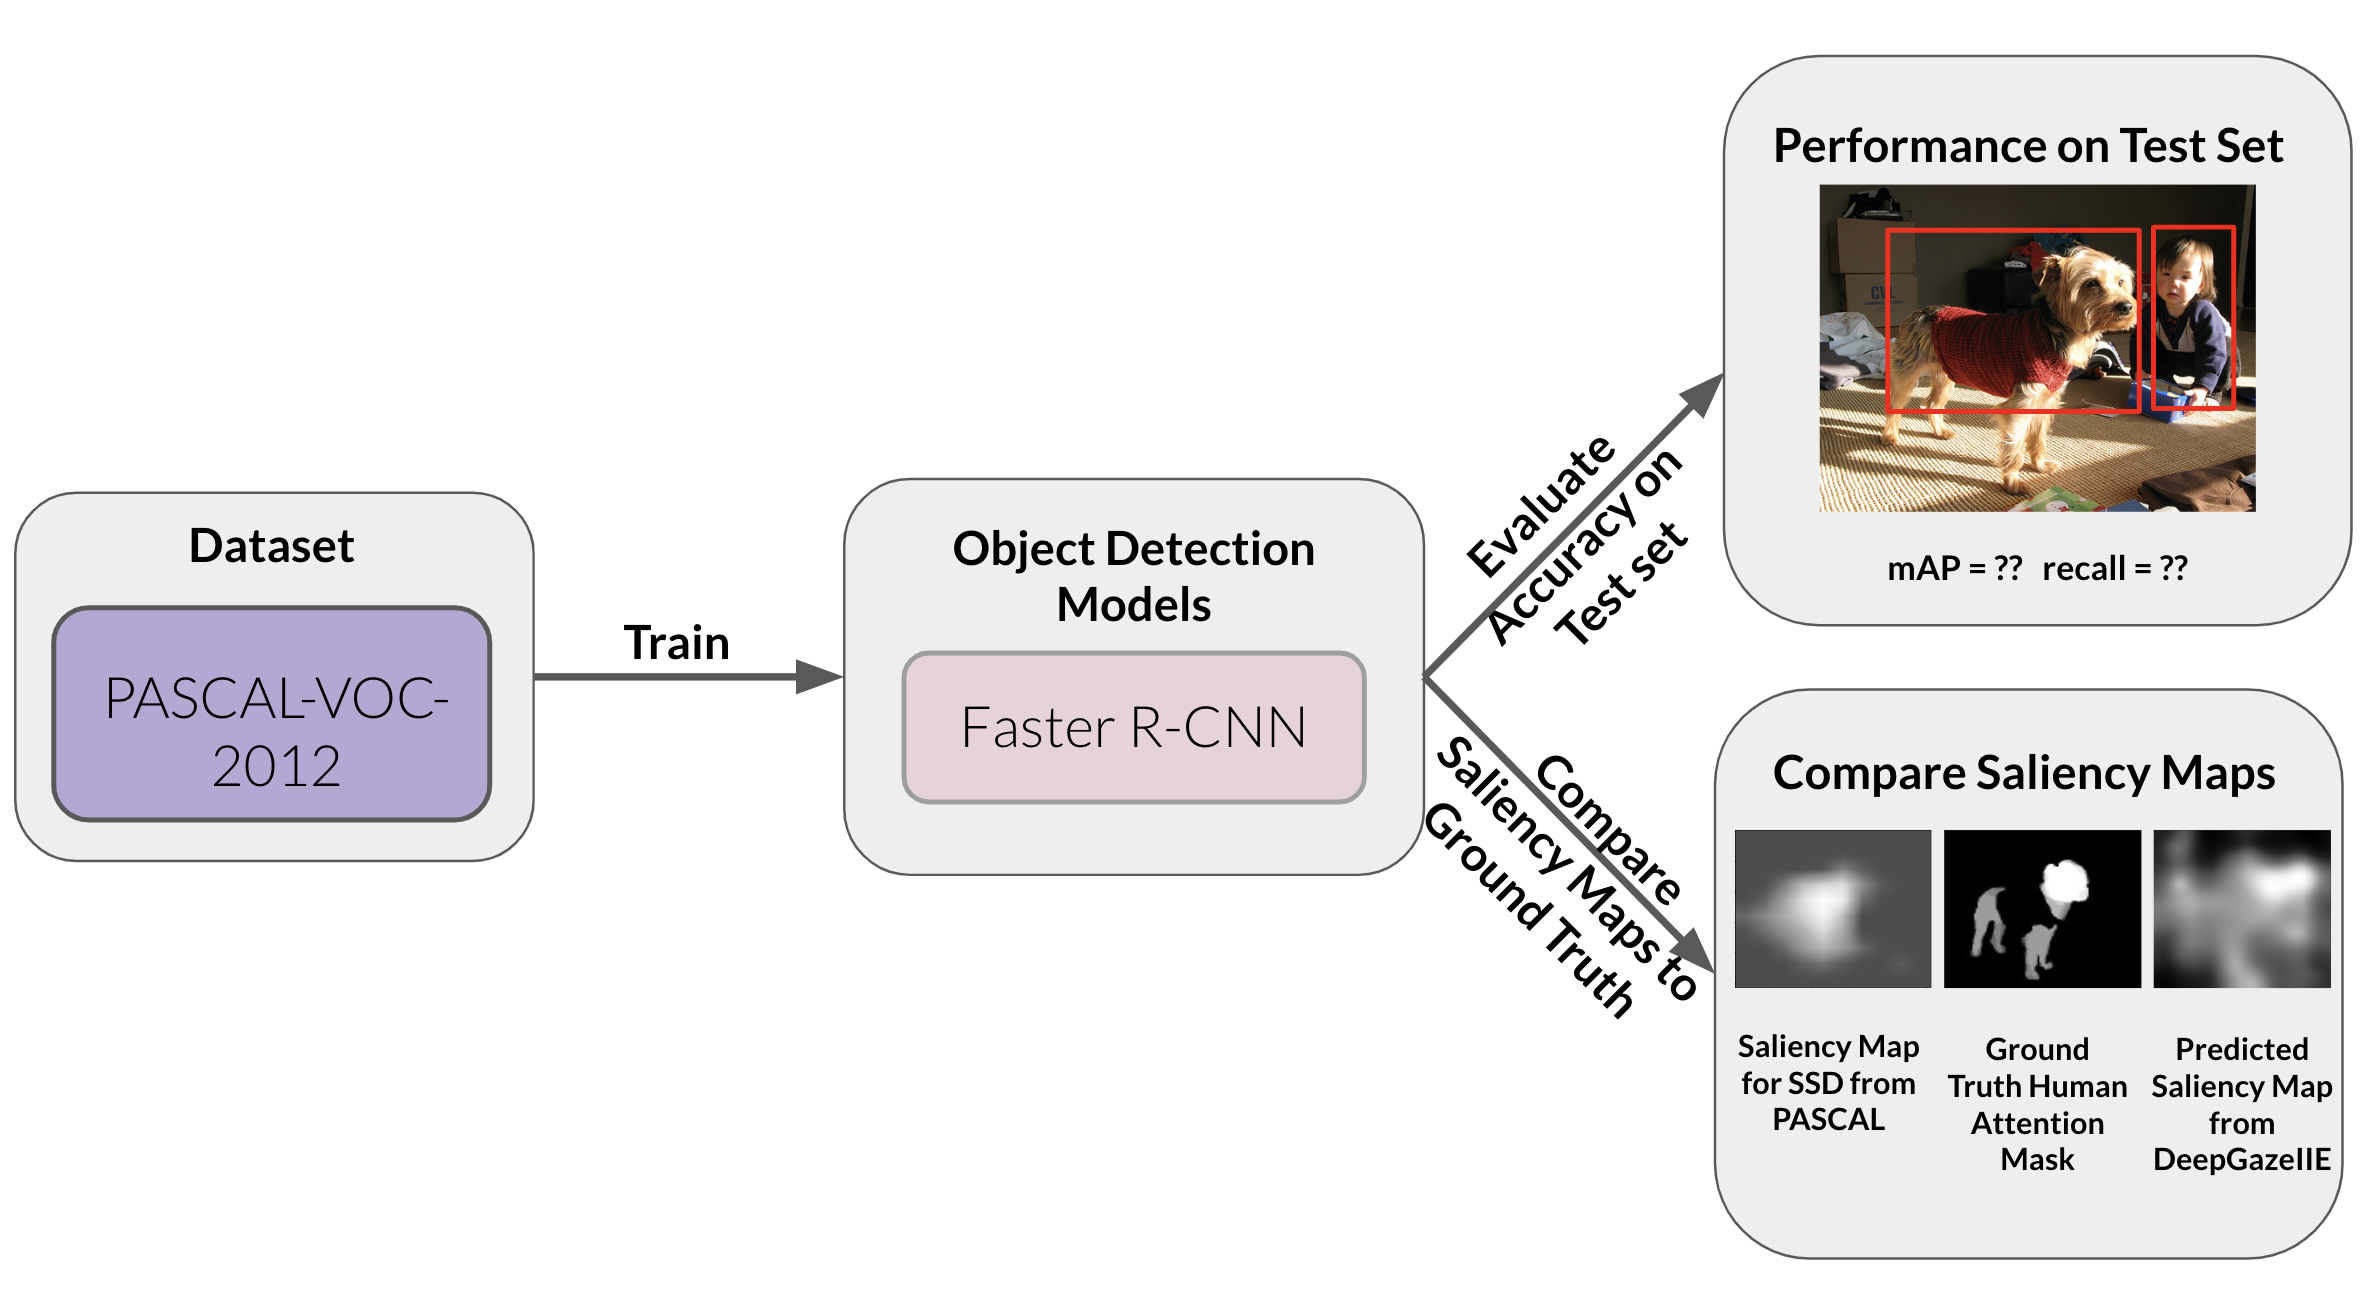
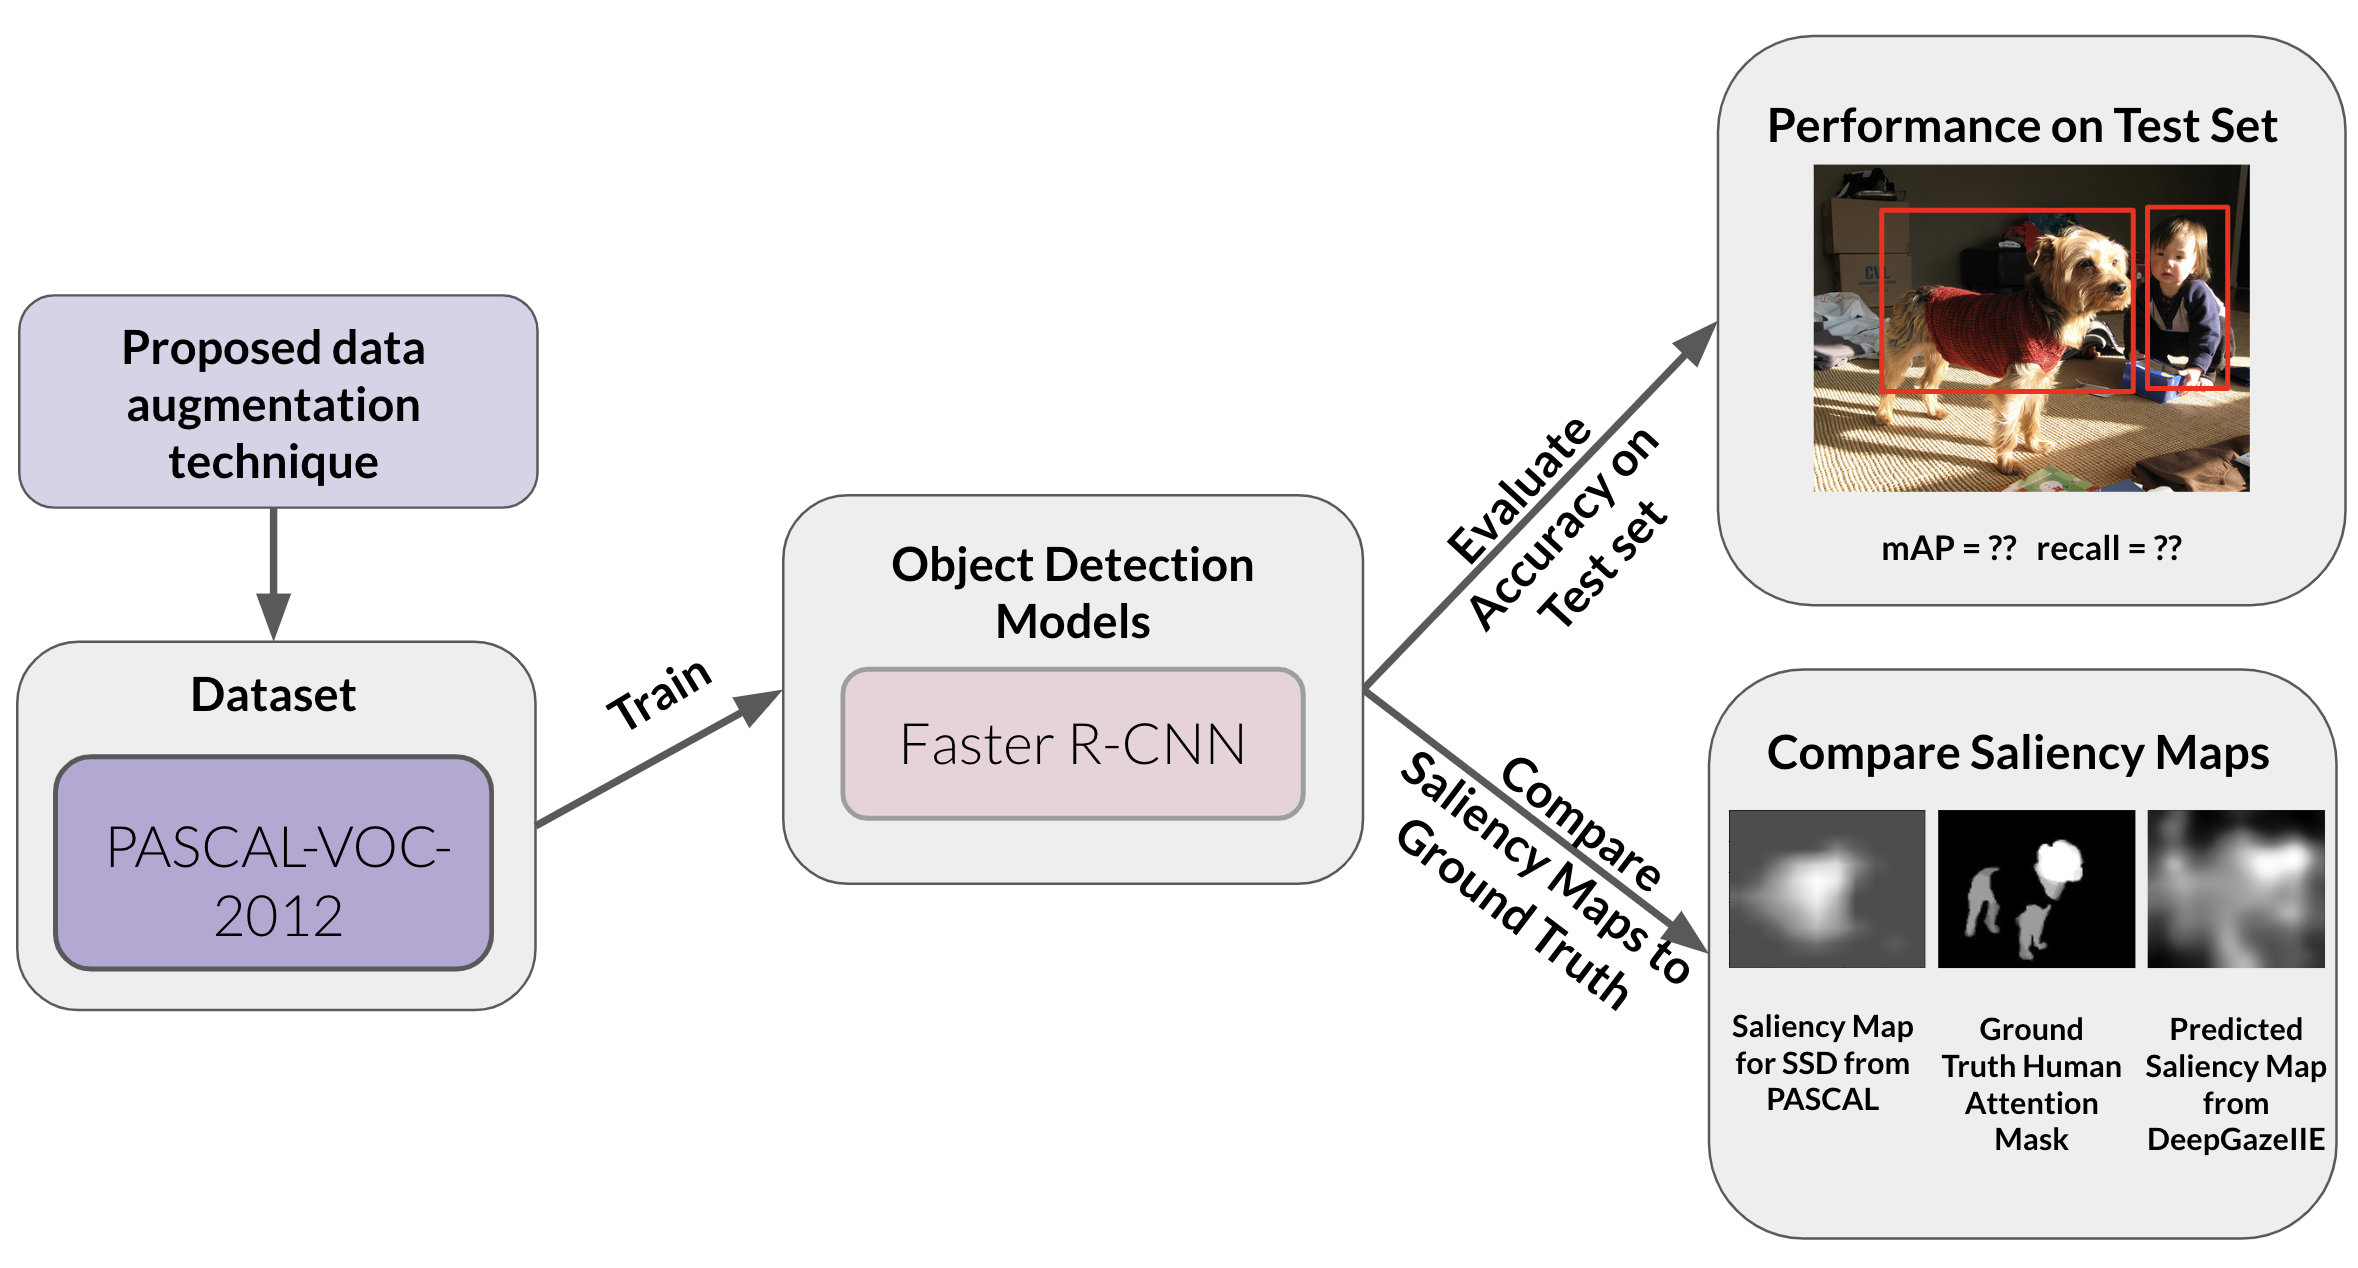
We gather a baseline to compare our three different data augmentations against. In Figure 6, we show the pipeline we used for the baseline. We fine-tuned Faster R-CNN on our PASCAL2012VOC training set and save the model to later evaluate it on our PASCALVOC2012 test set. During evaluation we calculate the mean average precision (mAP) at IoU of 0.5. We also calculate the MAE and IoU between the saliency maps generated by the saved model and the predicted eye-fixations. We again calculate those metrics for the saliency maps generated by the model and the human attention masks.
For evaluating the impact of data augmentation, we created three different augmented PASCALVOC2012 training sets, one for each augmentation. Then we separately fine-tuned the pre-trained Faster R-CNN on each augmented dataset (shown in Figure 7). We do the same metric calculations as we did for the baseline model (mAP, IoU, and MAE).
For all fine-tuning, we used the following training parameters: 5 epochs, learning rate of 0.005, SGD optimizer with momentum set to 0.9 and weight decay set to 5e-4, and the StepLR learning rate scheduler with a step size of 2 and a gamma of 0.1.
Results
We present results from our empirical study and our main experiment which evaluates the impact of different data augmentation techniques. The empirical study was done to get a glimpse at how current saliency maps from state-of-the-art models compare to predicted and ground truth human attention. The main experiment extends the empirical study by evaluating the impact of different data augmentation techniques on the saliency maps.
Empirical Study
Results for comparing the saliency maps generated by object detection models to the DeepGazeIIE’s predicted eye-fixations on the MIT1003 dataset
We observed that the SSD with a VGG backbone generated saliency maps most similar to predicted eye-fixations in terms of the IoU metric with a value of $0.2379$. DETR, a transformer-based architecture, generated saliency maps most similar to the predicted eye-fixations in terms of the MAE metric with a value of $0.1275$.
Table 1: Object Detection Models compared to DeepGazeIIE Predicted Eye-Fixations for MIT1003
| Model | MAE | IoU |
|---|---|---|
| YOLOV5 | $0.1799$ | $0.1895$ |
| SSD-VGG16 | $0.1643$ | 0.2379 |
| SSD-MobileNet | $0.1553$ | $0.1670$ |
| Faster R-CNN | $0.1441$ | $0.1896$ |
| RetinaNet | $0.2966$ | $0.1857$ |
| Mask R-CNN | $0.1550$ | $0.1678$ |
| DETR | 0.1275 | $0.2136$ |
Example Saliency Map Results
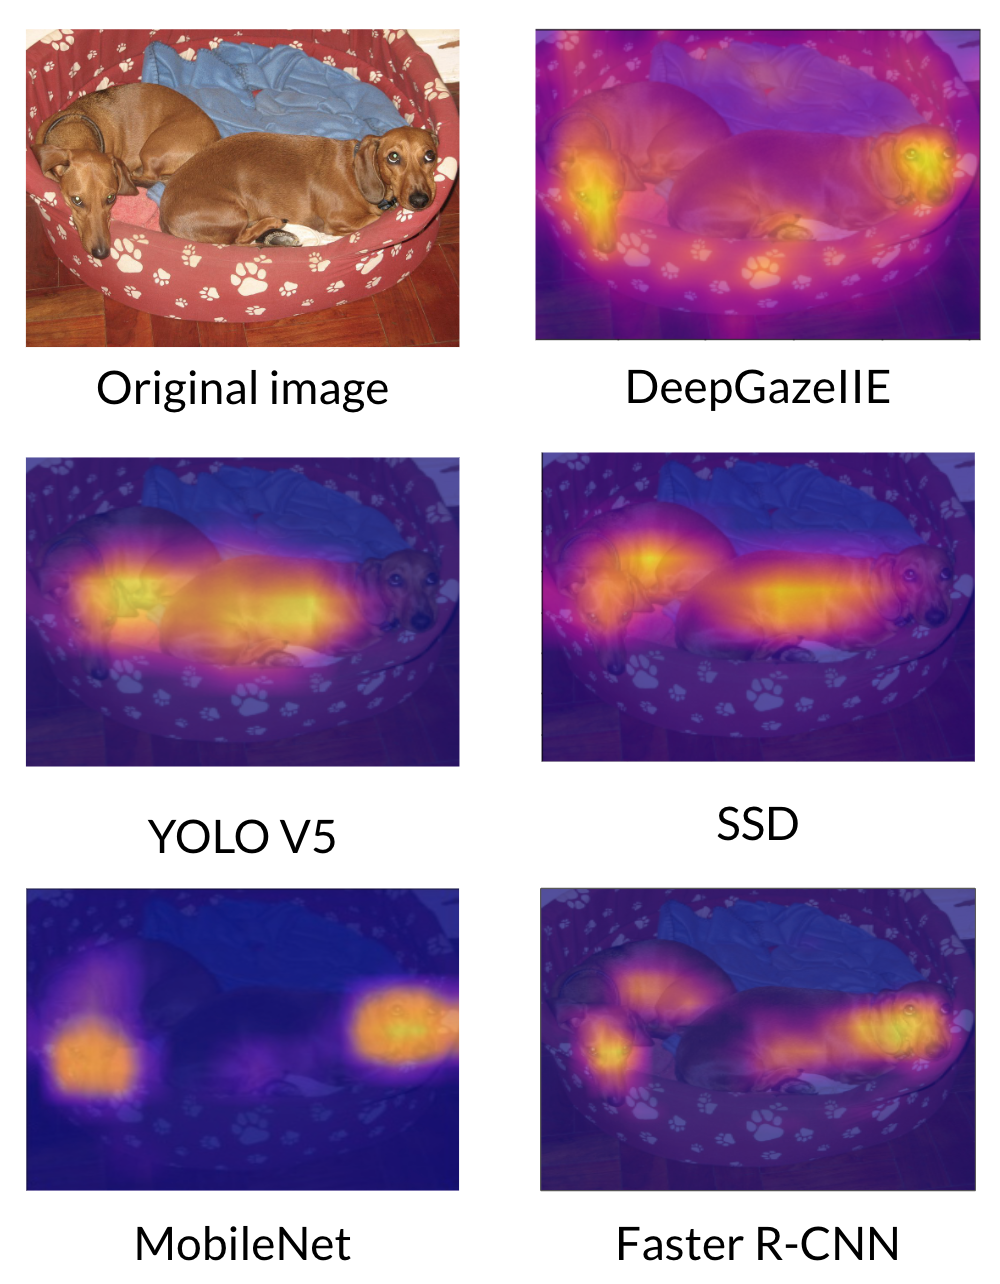
We also conducted the same study between the saliency maps from the models and the predicted eye-fixations as well as ground truth for a subset of PASCALVOC2012. This subset was determined based on the PASCALVOC2012 images that had a ground truth human attention map in the ML Interpretability Evaluation Benchmark. We observed that Faster R-CNN with a ResNet50 backbone generated saliency maps most similar to the predicted eye-fixations and the human attention masks in terms of MAE with values of $0.1700$ and $0.1145$ respectively. In terms of IoU, the SSD with a VGG backbone generated saliency maps most similar to the predicted eye-fixations and human attention masks with values of $0.2474$ and $0.3225$ respectively.
Table 2: Object Detection Models compared to DeepGazeIIE Predicted Eye-Fixations for PASCALVOC2012
| Model | MAE | IoU |
|---|---|---|
| YOLOV5 | $0.2147$ | $0.1837$ |
| SSD-VGG16 | $0.1731$ | 0.2474 |
| SSD-MobileNet | $0.1737$ | $0.2086$ |
| Faster R-CNN | 0.1700 | $0.2382$ |
| RetinaNet | $0.2578$ | $0.2158$ |
| Mask R-CNN | $0.1753$ | $0.2353$ |
| DETR | $0.1913$ | $0.1664$ |
Example Saliency Map Results
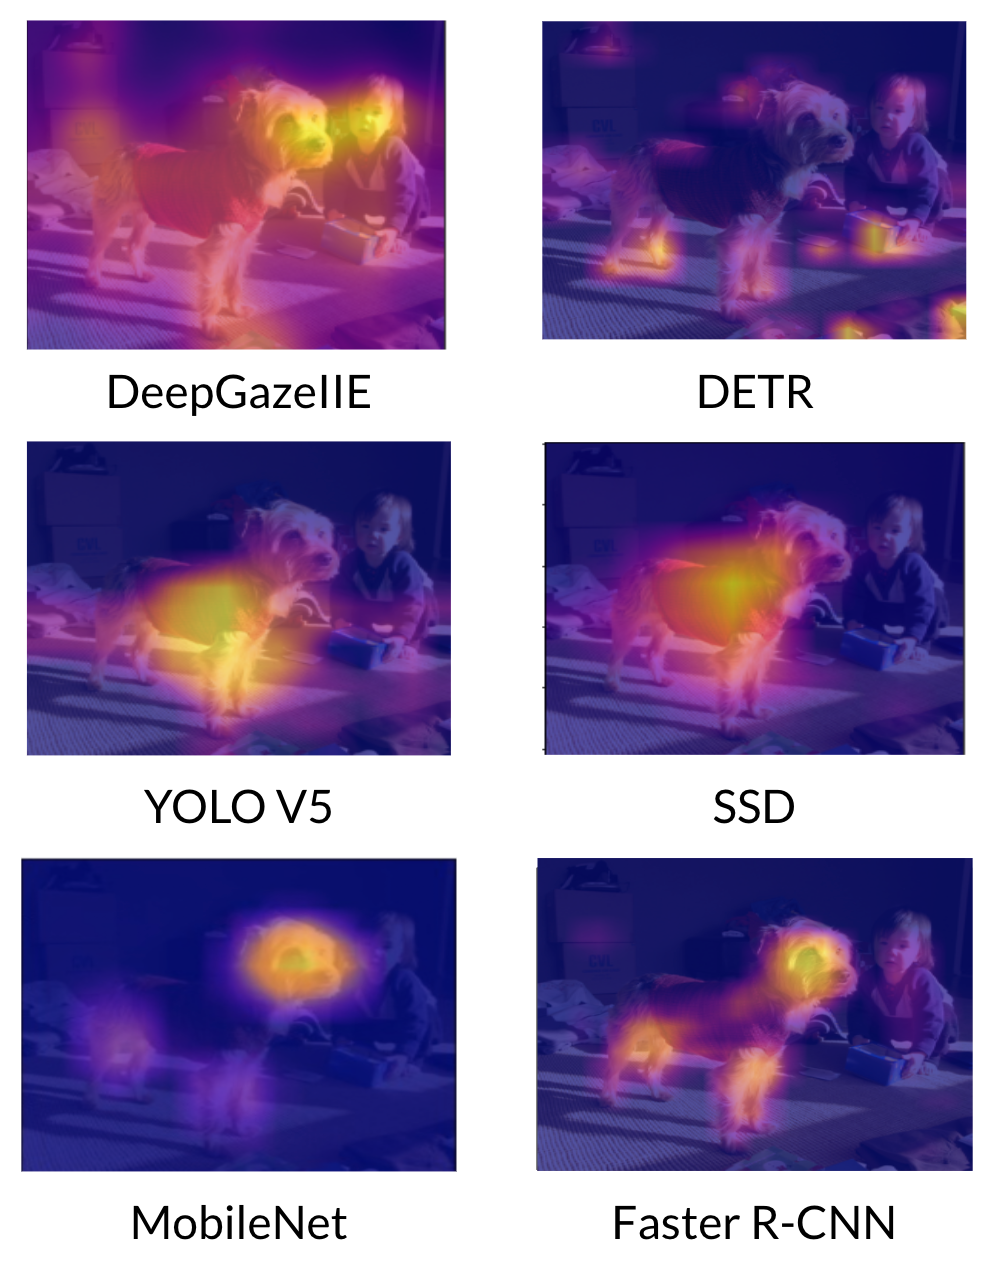
Table 3: Object Detection Models compared to Human Attention Masks for PASCALVOC2012
| Model | MAE | IoU |
|---|---|---|
| YOLOV5 | $0.1571$ | $0.2400$ |
| SSD-VGG16 | $0.1277$ | 0.3225 |
| SSD-MobileNet | $0.1765$ | $0.2086$ |
| Faster R-CNN | 0.1145 | $0.2438$ |
| RetinaNet | $0.2073$ | $0.2313$ |
| Mask R-CNN | $0.1254$ | $0.2234$ |
| DETR | $0.1519$ | $0.2100$ |
Example Saliency Map Results
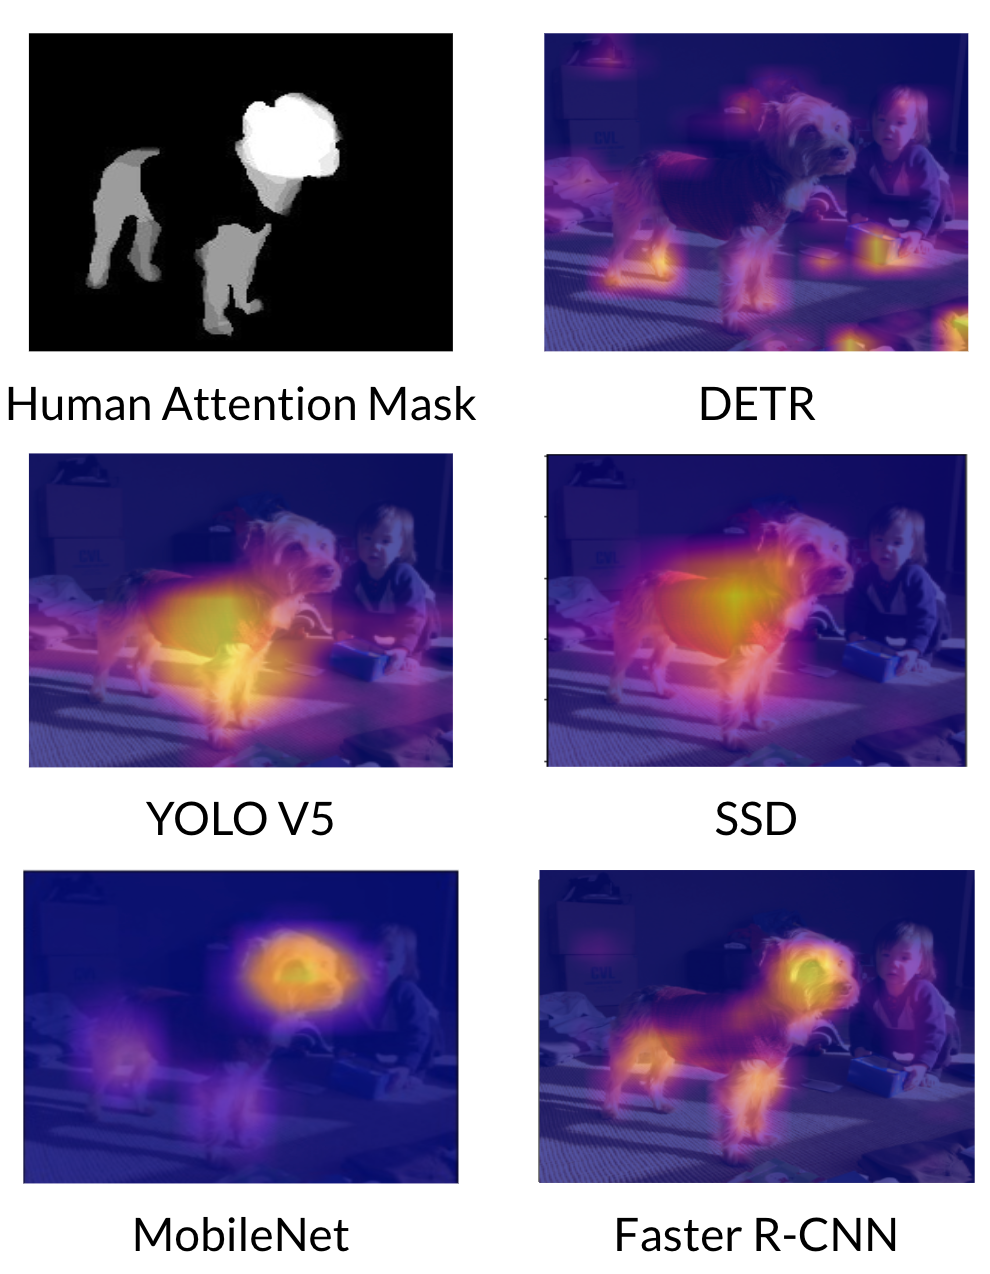
We identify a top preforming model in terms of MAE because this metric is not variable based on a threshold like IoU. We selected the top performing model for our main experiment to focus on the impact of the augmentations for one model instead of comparing the impact of augmentations across different models. Since Faster R-CNN performed the best for MAE on PASCALVOC2012, we use this model in our main experiment.
Main Experiment
We separately fine-tune a pre-trained Faster R-CNN on each data augmentation technique and with no data augmentation and then evaluate that model on the test images. We calculate mean average precision to understand the performance of each model and we calculate mean absolute error and intersection over union between the saliency maps generated by the model and the predicted eye-fixations or human attention masks.
The Faster R-CNN generated saliency maps that were more similar to predicted eye-fixations in terms of MAE when using selective inpainting augmentation and in terms of IoU when using selective erasing. These augmentations impacted the mAP by at most 3%.
Table 4: Pre-trained Faster R-CNN Fine-tuned on PASCALVOC2012 Compared to Predicted Eye-Fixations
| Augmentation | mAP (IoU=0.5) | MAE | IoU |
|---|---|---|---|
| Selective Erasing | $0.754$ | $0.1560$ | 0.1878 |
| Selective Inpainting | $0.763$ | 0.1552 | $0.1863$ |
| Non-Trivial Transformations | $0.781$ | $0.1581$ | $0.1762$ |
| No augmentations | 0.787 | $0.1575$ | $0.1823$ |
Table 5: Pre-trained Faster R-CNN Fine-tuned on PASCALVOC2012 Compared to Human Attention Masks
| Augmentation | mAP (IoU=0.5) | MAE | IoU |
|---|---|---|---|
| Selective Erasing | $0.754$ | 0.1561 | $0.2657$ |
| Selective Inpainting | $0.763$ | $0.1572$ | $0.2657$ |
| Non-Trivial Transformations | $0.781$ | $0.1600$ | $0.2676$ |
| No augmentations | 0.787 | $0.1583$ | 0.2688 |
Limitations
Access to Compute Power
We did this entire project on Google Colab which limited us in terms of the GPU that we could use and the amount of memory we had. We were able to use Colab Pro, but even then the GPUs we were using were limited to 16GB which forced us to use smaller batch sizes than normal.
Pre-trained models trained on COCO
The pre-trained models we used in our empirical study were from the PyTorch torchvision library
Selective Erasing/Inpainted Derived from DeepGazeIIE
The selective erasing and selective inpainting augmentations only used the predicted eye fixations to create the dataset which could explain the null results shown in Table 4. Future work should create a separate augmented dataset using the human attention masks instead of predicted eye-fixations.
Future Work & Conclusion
Future work should explore these questions for just image classification instead of the task of object detection. Another possibility would be to create a novel loss function that incorporates the IoU between the saliency map generated from the model and the saliency map of the DeepGazeIIE or similar saliency prediction model. This will train the model to focus on semantically meaningful regions of the image with ground truth labels as shown by
Overall, we conduct two studies to understand how current object detection models compare to human attention and what techniques might improve them. We evaluate two novel data augmentation pipelines in addition to non-trivial transforms to see if they help saliency maps become more human centered without significantly sacrificing accuracy. With at most 3% mAP difference, we observe that data augmentations that are derived from predicted human attention can improve the mean absolute error and intersection over union between the model saliency and predicted attention. We do not observe anything significant for the human attention mask, primarily because the dataset was derived from predicted eye-fixations which could be slightly different from the human attention masks.
Code


We completed this project to satisfy the project requirement for 16-824: Visual Learning & Recognition. We want to thank the TAs and Professor for their hard work and dedication to the class throughout the semester.