Designing Learning Experiences to Teach About Human-Centered XAI
Introduction
What initially started out as a group project for the Data Visualization class at Carnegie Mellon University in Fall 2021 with Swetha Kannan quickly turned into a powerful educational tool to teach students about human-centered explainable AI. As I started doing research on Explainable AI at the start of my Ph.D., I realized that saliency maps from the same method will be different depending on the model architecture you use and similarly will align or misalign with human perception depending on the XAI method and architecture (see my spotlight workshop paper at CVPR on this topic for an experimental evaluation). This inspired me to make an interactive tool that allows a user to compare how their perception aligns with an AI’s explanation.
Background on Human-Centered Explainable AI
Although it is important to lecture on the theory of explainable AI methods, it is equally important to understand the key findings from the research field’s enormous effort on the topic. That includes the (mis)alignment between human perception and AI explanation. There are several evaluations with and without humans on this topic, and I encourage you to read about them. The related works section 2.3 of my CSCW paper on Evaluating the Interpretability of Explainable AI Techniques through a Game With a Purpose and this paper from Angie Boggust on measuring human-AI alignment through XAI are good resources on this topic.
Ultimately, it is necessary to educate students about the potential for AI explanations to misalign with human perception. Lecturing on this and giving example images can of course help provide students an understand on this topic, but having them experience it themselves can really help them understand how exactly that misalignment manifests.
Interactive Saliency Maps
For our class project, Swetha and I developed an interactive saliency maps interface that we called Insightful Saliency Maps. There are multiple components to the prototype, beyond capturing human-AI misalignment, that allow for unique visualizations of saliency maps from different architectures that people can explore if interested. However, the main focus of this short blog post is about the ‘Explain an Image’ tab.
Explain an Image
In the current implementation of the ‘Explain an Image’ tab, students can explore how their own perception of classifying an image compares to how an AI systems classify that image. Here, we use an example of the Doberman Pincher from ImageNet-1K. The GIF below shows how students can select a color that maps to the color gradient of a saliency map, such as Grad-CAM or XRAI, to draw over the image. As they draw over the image with different colors reflecting different levels of importance, they are shown a side-by-side comparison between their reasoning and the model’s.
This hands-on approach highlights a key insight: humans and models have different perception and often rely on different cues. Surfacing those discrepancies helps learners reason about model behavior, understand the pros and cons of saliency maps in human-AI interactions, and think more critically about AI explanations. This activity also can help students internalize that saliency maps are not ground truth and may reflect biases in the dataset that a model was trained on. I encourage those interested in this topic to review this paper on Sanity Checks for Saliency Maps.
Using it in the Classroom
This is an activity that I have integrated into guest lectures that I have given on transparency and interpretability at Carnegie Mellon University. This active learning approach can help the students better connect the theory to practice by letting them experience it firsthand. I have integrated this activity into my lectures by first introducing explainable AI and different types of XAI methods, such as feature importance and saliency maps. Then, I describe the activity and have the students go to this website to each draw what regions they think are most important to classifying this image as a doberman pincher. After 5 minutes, I have students upload their drawings to a google doc (or any shared communication platform you prefer) and we discuss as a class surprises in (mis)alignment with the AI’s explanation. This discussion leads back nicely into the lecture where I introduce the pros and cons of saliency maps (grounded in XAI and HCI literature).
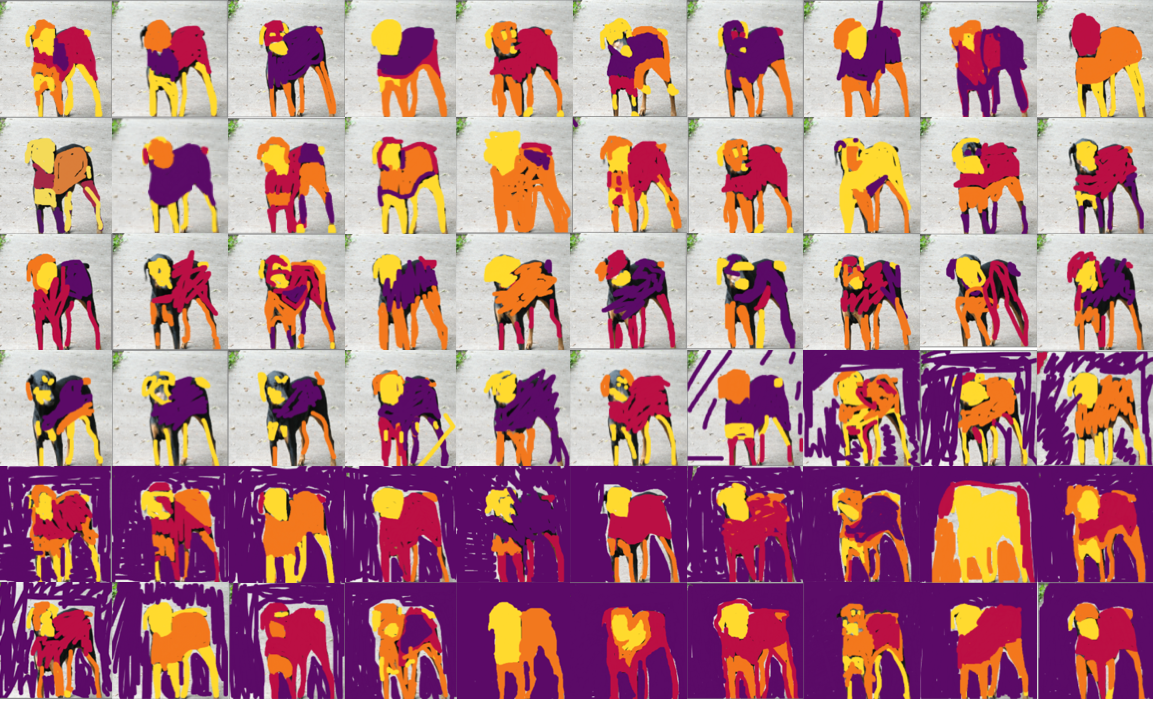
Samples from Students
Here is a collection of students’ annotated maps from the various guest lectures I gave. Each one reflects a distinct interpretation of what matters in the image. Visualizing all these responses together highlights a crucial point: human perception itself isn’t uniform—and comparing that variance to the model’s behavior helps students appreciate why explainability is a human-centered discipline.
Future Work
This was just a quick group project that Swetha and I did during the first semester of my Ph.D.. Below are features I’m excited to explore and that others are welcome to build on:
- Additional saliency techniques: Right now the interface uses XRAI for the ‘Explain an Image’ tab. In the future, I would like to add other saliency map techniques, such as Grad-CAM, Integrated Gradients, LIME, and SHAP.
- More advanced drawing tools: Right now the interface is minimal in its drawing capabilities. You cannot erase or change the brush size. This would allow students more flexibility during their interactions.
- Larger and more diverse image sets: Right now the only image to explain is the doberman. It would be great to have a bigger library of images that students can try out and explore.
- Real-time inference: Right now, the AI explanation was pre-generated offline. Instead of using precomputed saliency maps, it would be great to integrate a live classification model.
Code
Explore the full prototype in the repository above.
Portions of this blog post were written with the assistance of GPT-5. That content was modified and reviewed for accuracy.